

← All modules
Standalone add-on
KPI-Board
Track response and resolution times and find tickets still awaiting a first reply. KPI-Board includes a dashboard, a wallboard, PDF and Excel reports, and a plugin interface for custom reporting.
70 €per month
Billed annually in advance · pricing and terms →
All prices shown are final.Enquire about this add-on →Keep response times and service performance in view.
How quickly does support respond, how are resolution times changing, and which customers still await a first response? KPI-Board presents Znuny metrics in a clear overview. Evaluation is independent of configured system SLAs; periods and targets are agreed for your use.
KPI-BOARD · VIEWS AND REPORTS
Keep your support performance in view.
See which tickets are awaiting a reply and how response and resolution times develop. Use the wallboard in the office and take PDF or Excel reports into your next meeting.
Dashboard
Track response times, resolution times and pending replies.
Waiting for first response
#10428IT_HelpdeskSample customer ANormal · 1:40 h remaining
| Group | Tickets | Avg response | Median | p90 | Response target met | Avg resolution | Median | Resolution target met |
|---|---|---|---|---|---|---|---|---|
| Service_DE | 168 | 1:24 h | 0:36 h | 4:10 h | 2.8 d | 1.5 d | ||
| IT_Helpdesk | 126 | 1:48 h | 0:45 h | 5:20 h | 3.4 d | 2.0 d | ||
| Anwendungen | 94 | 1:12 h | 0:28 h | 3:40 h | 2.1 d | 1.2 d | ||
| Kundenservice | 40 | 2:06 h | 0:52 h | 6:15 h | 4.2 d | 2.6 d |
Monthly development
● Response target met● Resolution target met▥ Ticket volume
| Group | Tickets | Avg response | Median | p90 | Response target met | Avg resolution | Median | Resolution target met |
|---|---|---|---|---|---|---|---|---|
| Störung | 214 | 1:32 h | 0:38 h | 4:30 h | 2.9 d | 1.7 d | ||
| Serviceanfrage | 146 | 1:16 h | 0:31 h | 3:52 h | 2.2 d | 1.3 d | ||
| Beratung | 68 | 2:10 h | 0:58 h | 6:20 h | 4.1 d | 2.5 d |
| Group | Tickets | Avg response | Median | p90 | Response target met | Avg resolution | Median | Resolution target met |
|---|---|---|---|---|---|---|---|---|
| Hoch | 92 | 0:46 h | 0:20 h | 2:14 h | 1.6 d | 0.8 d | ||
| Normal | 336 | 1:52 h | 0:48 h | 5:36 h | 3.3 d | 1.9 d |
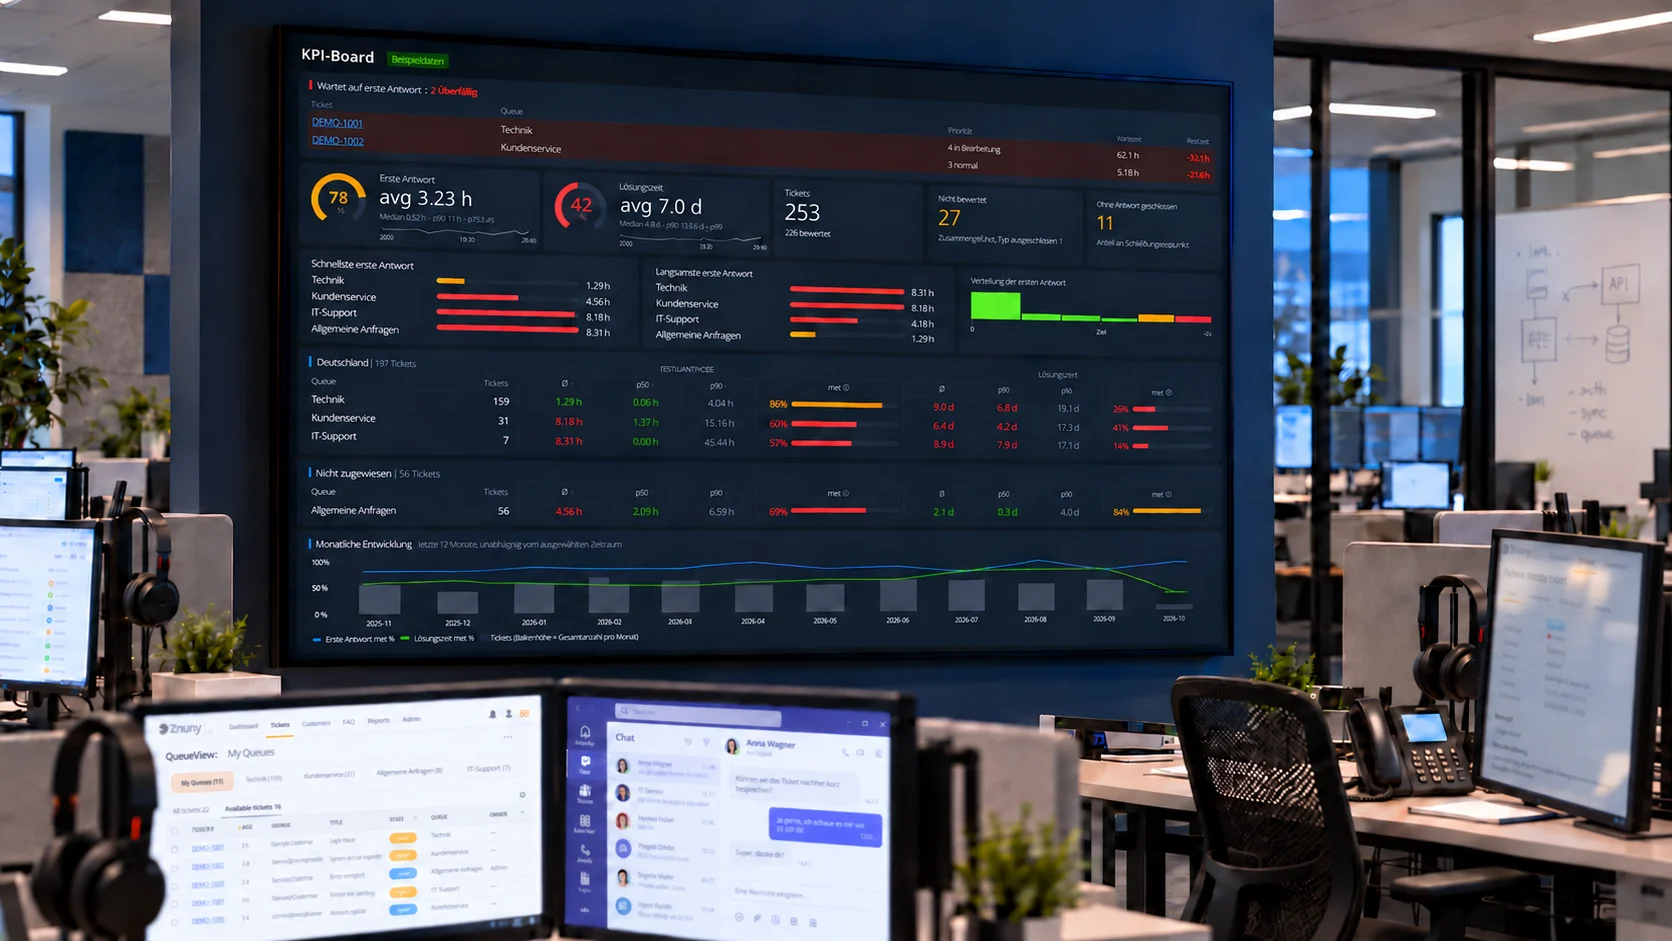
Wallboard
Display the metrics on a shared team monitor.
KPI-BoardSample data
Waiting for first response 2 · 2 overdue
TicketQueuePrioritywaitingTime left
DEMO-1001Technical support4 · In progress6:21 h−3:21 h
DEMO-1002Customer service3 · Normal5:18 h−2:18 h
First response
Ø 3:23 hMedian 0:52 h · p90 53:11 h · 176/226Resolution time
Ø 7.0 dMedian 4.0 d · p90 19.1 d · 95/226Tickets
253226 ratedNot rated
27Listed separatelyClosed without response
11At the time of closureFastest first response
Technical support1:29 h
Customer service4:56 h
IT-Support8:18 h
General enquiries8:31 h
Slowest first response
General enquiries8:31 h
IT-Support8:18 h
Customer service4:56 h
Technical support1:29 h
Distribution of first response
0–1 h
1–2 h
2–3 h
3–4 h
4–6 h
>6 h
By queue 253 Tickets
| Queue | Tickets | Avg response | Median | p90 | met | Avg resolution | Median | met |
|---|---|---|---|---|---|---|---|---|
| Technical support | 159 | 1:29 h | 0:06 h | 4:04 h | 86% | 9.0 d | 6.8 d | 26% |
| IT-Support | 31 | 8:18 h | 1:37 h | 15:16 h | 60% | 6.4 d | 4.2 d | 41% |
| Customer service | 7 | 4:56 h | 0:00 h | 45:44 h | 57% | 8.9 d | 7.9 d | 14% |
| General enquiries | 56 | 8:31 h | 2:09 h | 6:59 h | 69% | 2.1 d | 0.3 d | 84% |
Monthly development 12 months, independent of the selected period
● First response met● Solution met▥ Ticket volume
PDF report
Export a report for meetings and internal distribution.
KPI Board
Period: 24 September – 24 October 2026 · sample report
Response target 91 %Resolution target 84 %Tickets 428Not rated 28
| Group | Tickets | Avg response | Median | Response target met | Avg resolution | Median | Resolution target met |
|---|---|---|---|---|---|---|---|
| Service_DE | 168 | 1:24 h | 0:36 h | 2.8 d | 1.5 d | ||
| IT_Helpdesk | 126 | 1:48 h | 0:45 h | 3.4 d | 2.0 d | ||
| Anwendungen | 94 | 1:12 h | 0:28 h | 2.1 d | 1.2 d | ||
| Kundenservice | 40 | 2:06 h | 0:52 h | 4.2 d | 2.6 d |
| Group | Tickets | Avg response | Median | Response target met | Avg resolution | Median | Resolution target met |
|---|---|---|---|---|---|---|---|
| Störung | 214 | 1:32 h | 0:38 h | 2.9 d | 1.7 d | ||
| Serviceanfrage | 146 | 1:16 h | 0:31 h | 2.2 d | 1.3 d | ||
| Beratung | 68 | 2:10 h | 0:58 h | 4.1 d | 2.5 d |
| Group | Tickets | Avg response | Median | Response target met | Avg resolution | Median | Resolution target met |
|---|---|---|---|---|---|---|---|
| Hoch | 92 | 0:46 h | 0:20 h | 1.6 d | 0.8 d | ||
| Normal | 336 | 1:52 h | 0:48 h | 3.3 d | 1.9 d |
| Group | Tickets | Avg response | Median | Response target met | Avg resolution | Median | Resolution target met |
|---|---|---|---|---|---|---|---|
| Kundenportal | 136 | 1:18 h | 0:32 h | 2.2 d | 1.3 d | ||
| 218 | 1:52 h | 0:46 h | 3.4 d | 2.0 d | |||
| Durch Mitarbeiter erfasst | 74 | 0:52 h | 0:21 h | 2.4 d | 1.4 d |
Addonflow · Entirely fictional sample data
Excel report
Analyse metrics and ticket details in separate worksheets.
KPI-Board_Muster.xlsxExample view
KPI Board
Period: 24 September – 24 October 2026 · sample report
| Group | Tickets | Avg response | Median | p90 | Response target met | Avg resolution | Median | Resolution target met |
|---|---|---|---|---|---|---|---|---|
| Service_DE | 168 | 1:24 h | 0:36 h | 4:10 h | 2.8 d | 1.5 d | ||
| IT_Helpdesk | 126 | 1:48 h | 0:45 h | 5:20 h | 3.4 d | 2.0 d | ||
| Anwendungen | 94 | 1:12 h | 0:28 h | 3:40 h | 2.1 d | 1.2 d | ||
| Kundenservice | 40 | 2:06 h | 0:52 h | 6:15 h | 4.2 d | 2.6 d |
QueueTicket typePriorityOriginMonthly developmentTicket DetailsNotesReport Config
Views recreated from the module interface and export layouts. All values, queues, ticket types and customers are fictional.
More than an average
Average, median and p90 help identify long waits. The median is the middle value; p90 is the value not exceeded by 90 percent of rated tickets.
Reports configured for your team
Compare queues, ticket types, priorities and origins. Configure targets and reporting for your support team. Additional plugins can provide custom reports and integrations.
PDF and Excel from the module
Use PDF to share a report and Excel for further analysis down to individual tickets. Required export components are checked during setup.
What the extension provides.
Compare response and resolution times by queue, ticket type and priority
Display service metrics and trends on a support monitor
Add customer-specific reports, views and integrations through custom plugins
Preparing to use the add-on.
- 1
Choose queues, reporting periods and metrics.
- 2
Review data preparation and display in your test environment.
- 3
Use the board or wallboard in everyday operations.
Test the add-on in your own Znuny test environment and approve its settings internally before production use. Assistance is available on request.
Installation and setup information is provided. Additional setup, advice or custom changes can be agreed separately.
Suggest a feature →